What It Does
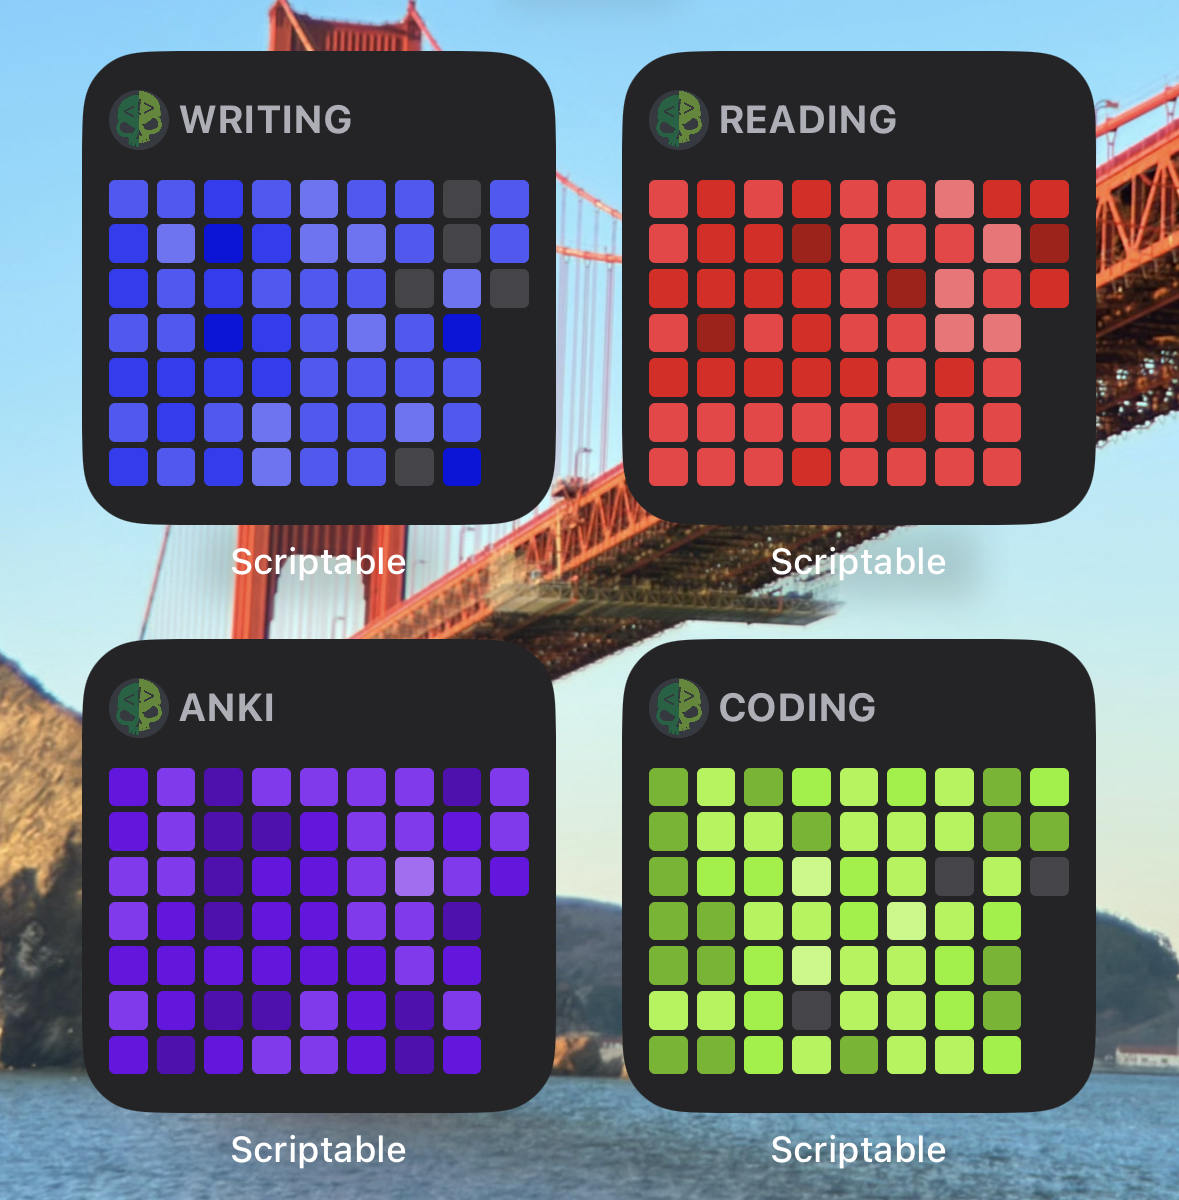
- Display your habit tracking data as a visual heatmap on your iPhone home screen
- Connect to Habitify's API to automatically sync your habit completion data
- Show daily consistency patterns at a glance without opening any apps
- Update automatically throughout the day as you complete habits
- Customize which habits to display with separate widgets for different goals
- Visualize streaks and gaps in your habit practice over time
Why I Built This
I have been a big believer in visualizing habits and goals, and putting them in a spot that is easy to see. What better place to see your habits and goals than your phone? I had tried printed goal sheets and a display board, but in the end they were just too much work to maintain.
I wanted something that would automatically update as I tracked my habits throughout the day. The iPhone home screen was the perfect location—somewhere I look at dozens of times per day without any extra effort. But I needed a way to build custom widgets that could pull data from my habit tracking app and display it in a meaningful, visual way.
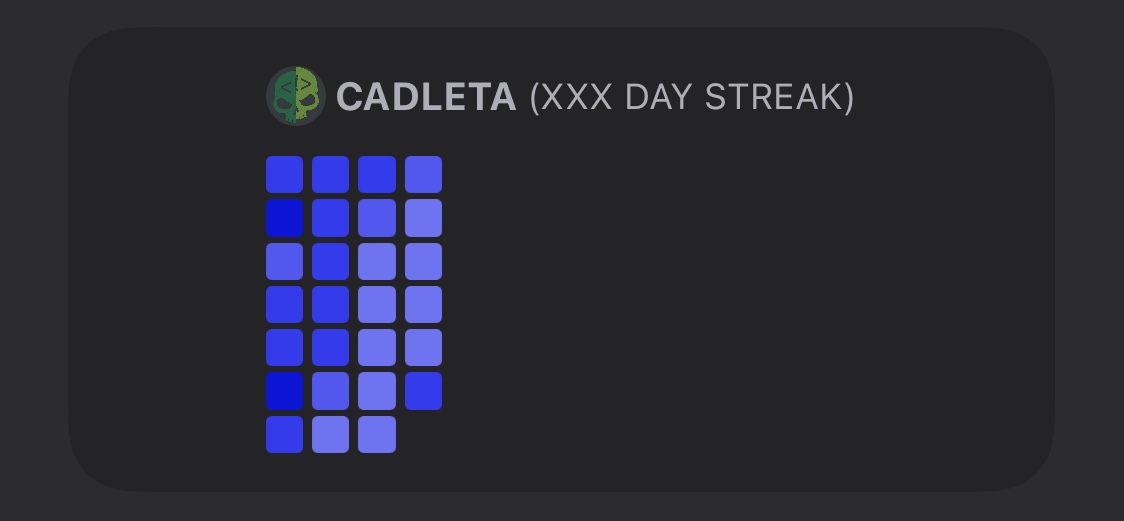 First draft of the heatmap: experimenting with layout and color schemes.
How It Works
The widgets are built using Scriptable, an iOS app that allows custom JavaScript widgets with a built-in display API. I found an existing GitHub contributions widget that visualized commit activity as a heatmap, then deconstructed how it generated the visualization based on dates and contribution levels.
The key technical challenge was connecting Habitify's API to the widget system. Habitify provides an API that returns habit completion logs with dates and status, but the data format didn't match what the heatmap expected. I had to write transformation code to convert Habitify's date format and habit IDs into the structure the widget could render. Each widget script is configured with a hard-coded habit ID and fetches fresh data on every refresh.
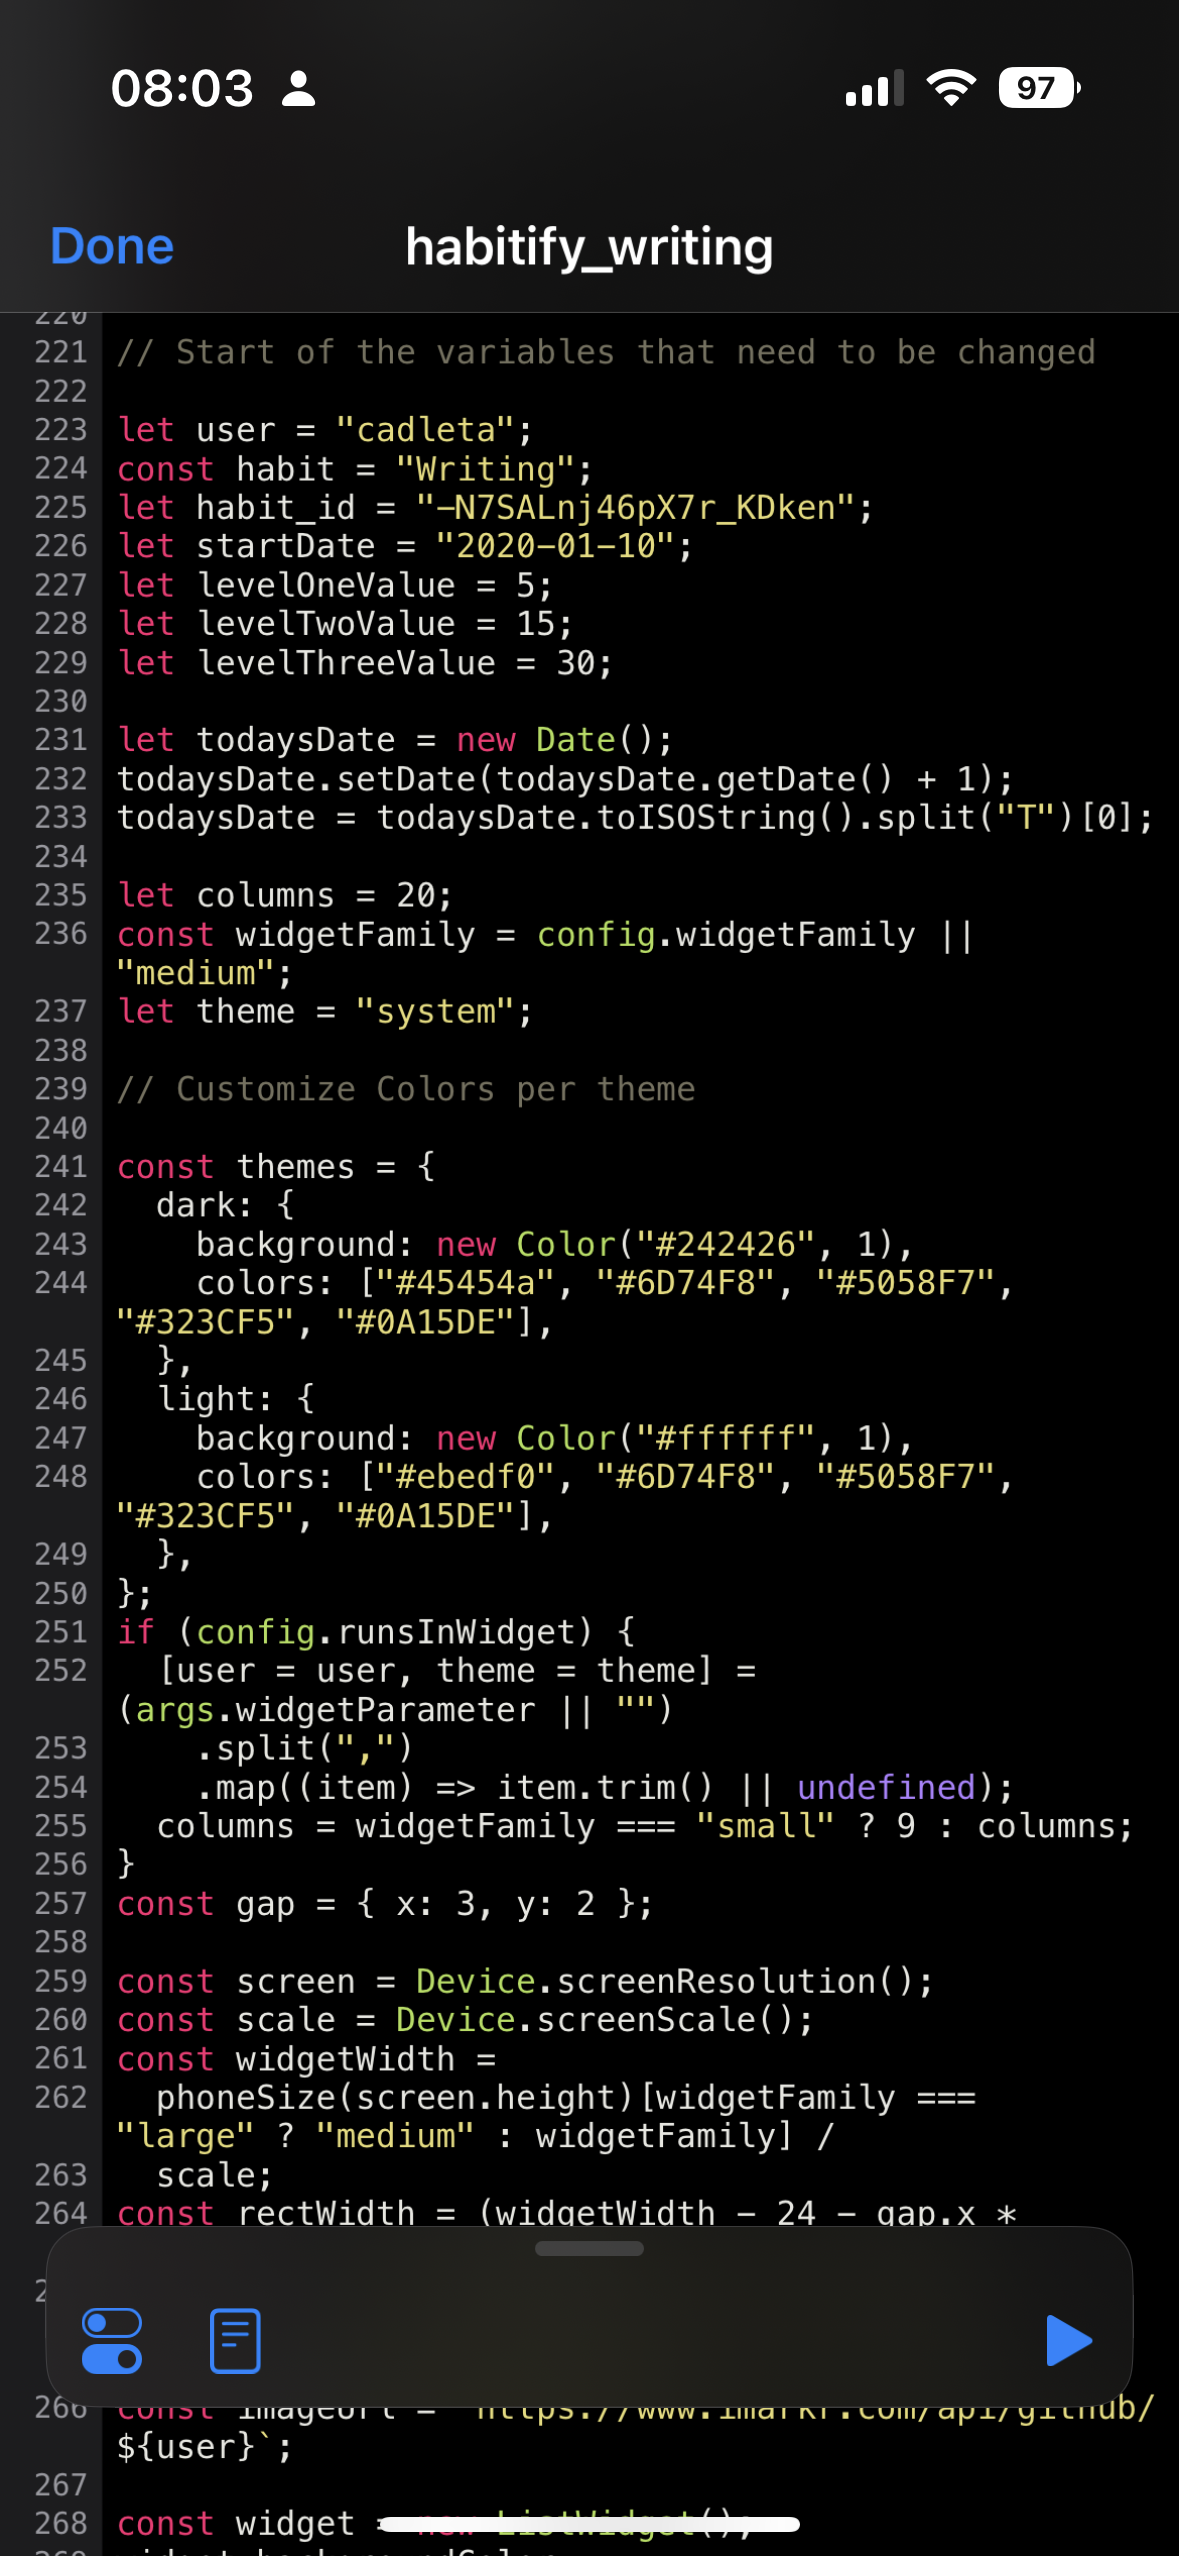 The custom JavaScript code that connects Habitify's API to the heatmap visualization.
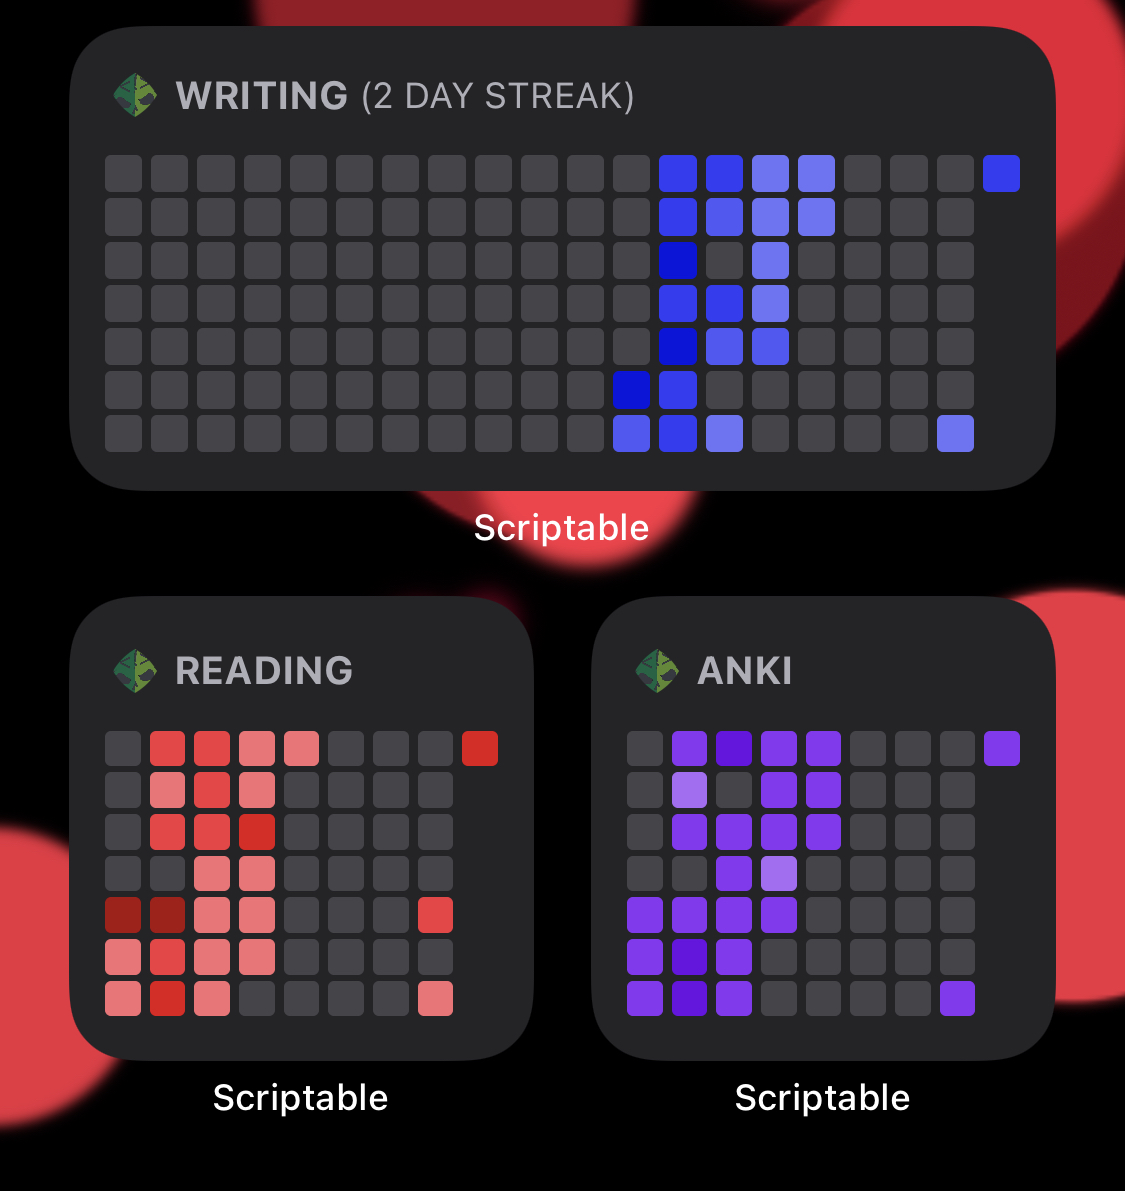 First days of using the heatmap: starting to build consistency.
Impact
By the numbers:
- Used daily since initial build to track multiple habits
- Eliminated the need to manually update physical goal sheets
- Reduced friction from opening apps to check habit progress
What changed:
- Made habit tracking passive—I see my progress automatically throughout the day
- Increased awareness of consistency patterns without requiring active checking
- Created a sustainable system that doesn't require manual maintenance
- Solved a multi-year problem of finding a digital display board that actually works
Challenges & Solutions
The most difficult aspect of this project was getting Habitify's API to work with the heatmap widget through Scriptable's networking layer. The Habitify habit IDs were different than I expected—they used a different format than what appeared in the app's UI. I spent hours using trial and error, logging API responses, and testing different ID formats until I found the correct ones.
The date format conversion was also tricky. Habitify returns timestamps in one format, but the heatmap widget expected dates in a specific ISO string format. I had to write conversion functions that handled timezone differences and ensured the dates aligned correctly with the calendar grid display.
Before finding Scriptable, I experimented with widgets that could display websites, planning to build a web-based heatmap. But none of the website widgets displayed content the way I wanted—they had scrolling issues, rendering problems, or couldn't refresh automatically. Finding Scriptable and the existing GitHub contributions widget was the breakthrough that made the whole project feasible.
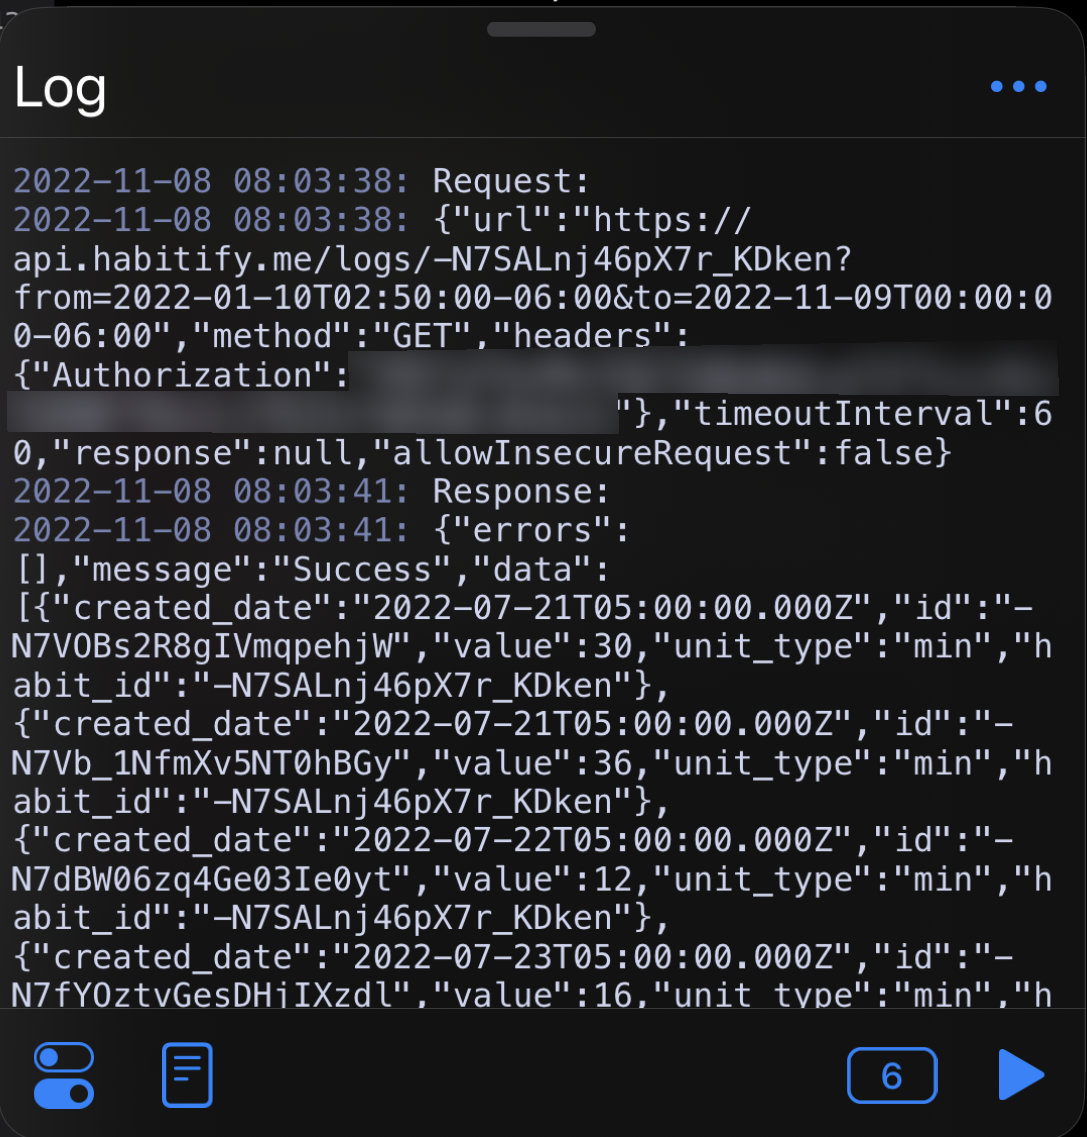 Debug logs from the widget: troubleshooting API connections and data transformations.
What I Learned
I learned that sometimes the best solutions come from creatively connecting existing tools rather than building everything from scratch. By finding the GitHub contributions widget and adapting it to my needs, I saved weeks of development time while still creating something custom and useful.
I also learned about the iOS widget ecosystem and how Scriptable enables powerful customization without requiring full app development. The JavaScript API it provides is surprisingly capable—you can make network requests, parse JSON, render complex layouts, and handle state persistence, all from a widget script.
Most importantly, I learned that good habit tracking tools should be visible and passive. The best system is one you don't have to remember to check—it's just there, showing you your progress as part of your daily routine.
Future improvements:
- Add support for multiple habits in a single widget with color-coded rows
- Build a configuration interface to avoid hard-coding habit IDs
- Add tap interactions to view detailed stats for specific days
- Create templates for common habit tracking patterns
- Explore Android alternatives using similar widget frameworks
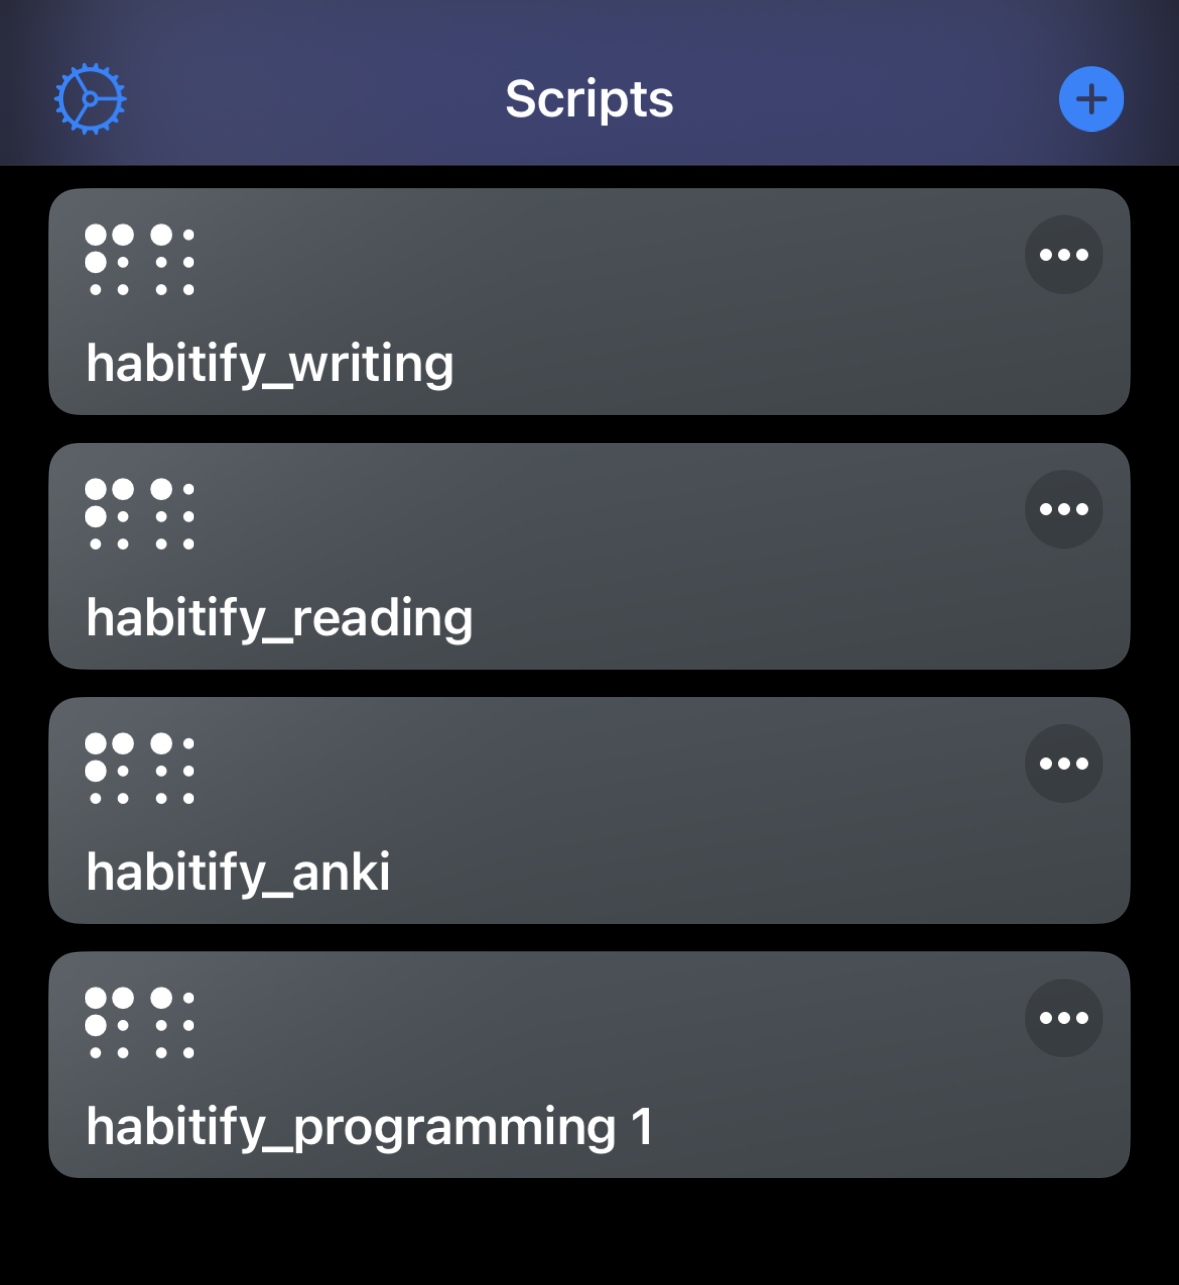 Various widget scripts in Scriptable: each configured for a different habit.
Links
- Scriptable: scriptable.app (iOS widget framework used)
- Habitify: Habitify API Documentation
- Inspiration: GitHub Contributions Widget (original heatmap implementation)
- Code: Private (custom widget scripts)
- Related: Goal Bar (another visual progress tracking tool)