
What It Does
- Takes a raw, messy backlog of tasks and turns it into a ranked master list based on a single score.
- Asks four key questions inspired by Procrastinate on Purpose (Is it optional? Can it be systematized? Can someone else do it? Can it wait?) to recommend whether to eliminate, automate, delegate, or do the task.
- Captures rich metadata for each task: length, benefits, detriments, how long the effects last, due date, and tags.
- Calculates a “return on time investment” style score that combines value, time cost, and how long the results will matter.
- Applies urgency multipliers so tasks that are due soon bubble to the top even if their raw ROI is average.
- Surfaces four views from the same source data: Master ToDo, Top 10%, Shit List (things to eliminate), and an Organization List for cleanup/maintenance tasks.
- Lets you experiment with different thresholds (percentiles) to control how “exclusive” the Top 10% list really is.
 The main view: a sorted Master ToDo on the left, with automatically generated Top 10%, Shit List, and Organization List views on the right.
Why I Built This
After reading Rory Vaden’s Procrastinate on Purpose and his Focus Funnel (Eliminate → Automate → Delegate → Procrastinate → Concentrate), I kept thinking: “What would this look like as a concrete algorithm?” I wanted something that didn’t just tell me to work on what matters, but actually did the filtering for me.
I also had a growing pile of tasks that all felt important: school assignments, side projects, reading lists, and random life admin. Manually reprioritizing everything was draining. So I went a little overboard and tried to encode every attribute that might matter into one calculation. ToFilter is the result: an experiment in building a ruthless, numbers-driven gatekeeper for my todo list.
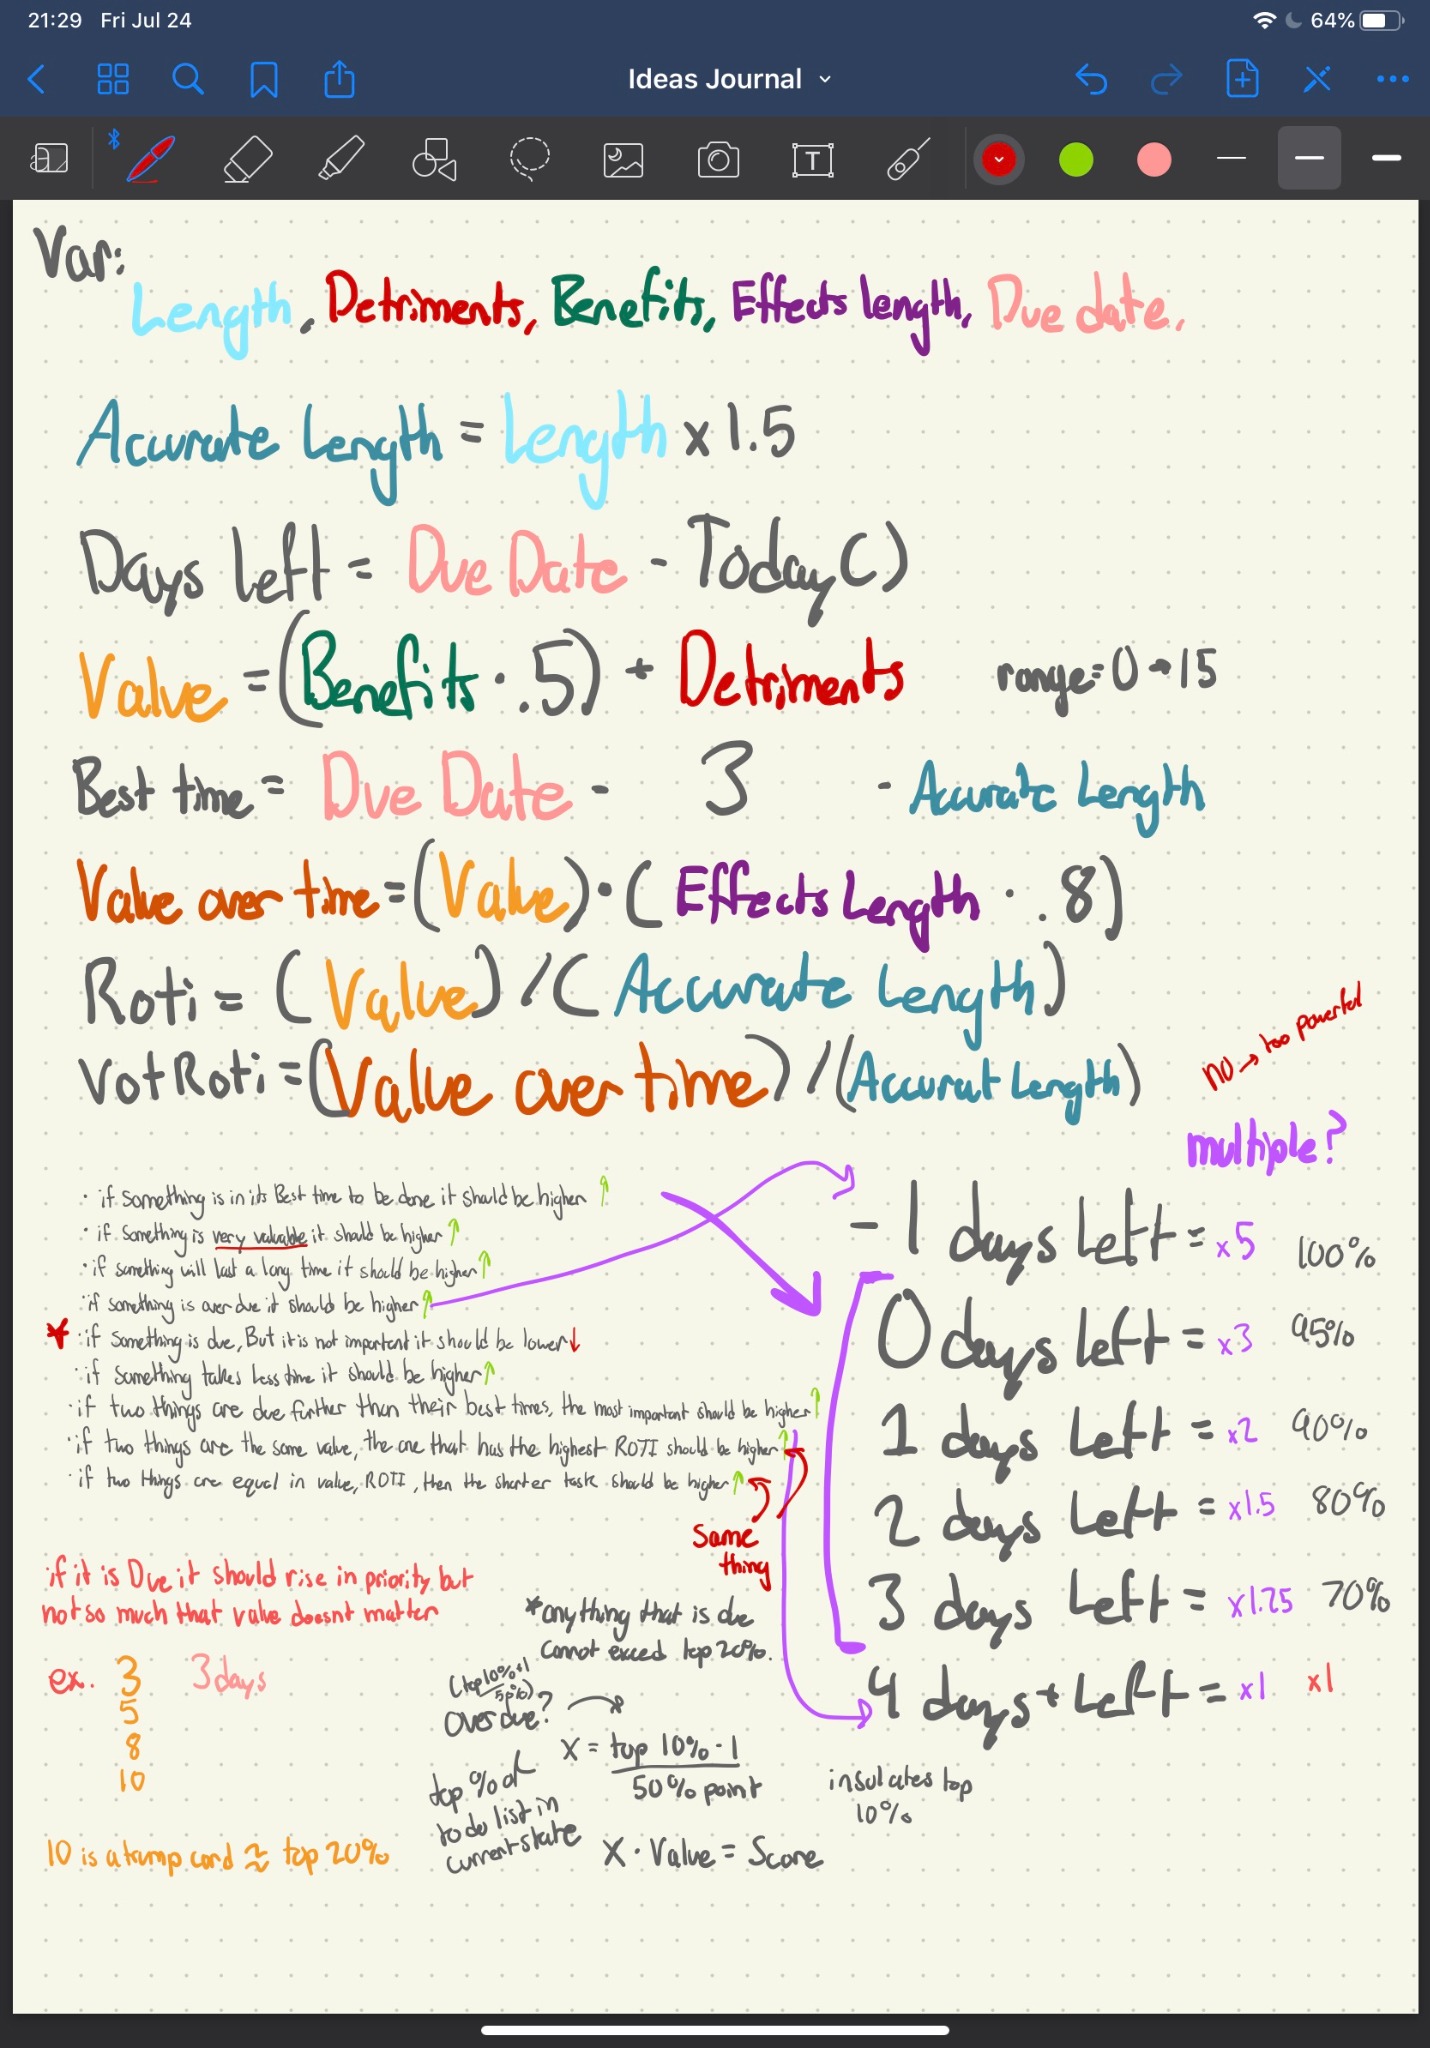
 Early notebook sketch: turning concepts like “value,” “urgency,” and “how long the results last” into actual formulas.
How It Works
ToFilter lives in a spreadsheet with three sheets: Input List, Master ToDo, and Terminated List. The Input List is the only place I type data; everything else is derived from formulas.
Each task has a Length estimate, plus sliders for Benefits, Detriments, and Effects length (how long the results matter, in days/weeks/months/years), and an optional Due date. From there the sheet computes:
- Accurate Length = Length × 1.5, to correct for the planning fallacy and buffer setup/cleanup time.
- Value = (Benefits × 0.75) + Detriments – a single “how much is this worth?” number that blends upside and the pain of not doing it.
- Effects # = Effects length converted into days, based on whether I entered days, weeks, months, or years.
- Value over time = Value × (Effects # × 0.8), so tasks that create benefits for weeks or months are rewarded without letting multi-year tasks blow up the scale.
- ROTI (Return on Time Investment) = Value ÷ Accurate Length.
- VROTI = Value over time ÷ Accurate Length – the “pure” ROI number before urgency kicks in.
Urgency is handled separately. If a task has a due date within the next four days, it gets a Days Left value from -1 (overdue) to 3. Each bucket is multiplied by an Urgent Multiplier derived from percentiles of the current VROTI distribution, so an overdue task gets boosted into the very top of the list while something due in three days gets a smaller bump. The final Score is:
Score = VROTI × (Urgent Multiplier based on Days Left)
The Focus Funnel questions live alongside this. Four yes/no columns drive a recommendation field: Eliminate if it’s optional, Automate if it can be systematized, Delegate if someone else can do it, and Be Patient if it can wait. Only the remainder make it through as “Do it.”
 Refining urgency: tuning days-left multipliers so due and overdue tasks jump into the top percentiles without overpowering everything else.
Impact
What it changed for me:
- Turned a vague, overwhelming backlog into a sortable, single-score queue I could just work down from the top.
- Forced me to confront low-value tasks I was emotionally attached to but logically should eliminate or delegate.
- Made “what should I work on next?” almost trivial – I just scan the Top 10% list instead of reconsidering everything.
- Gave me a sandbox for experimenting with different weighting schemes, without touching the raw task data.
Challenges & Solutions
The hardest part was collapsing so many dimensions into a single number without letting any one dimension dominate. Early versions multiplied everything together, which made long-term tasks absurdly powerful. Switching to a mix of addition, scaling factors, and percentile-based multipliers made the system behave more sanely.
Another challenge was urgency. If you boost due dates too aggressively, everything becomes a fire drill. If you don’t boost them enough, important-but-not-enjoyable work sinks. The current solution only applies urgency multipliers in the last four days before a due date, and scales the multipliers from “overdue” down to “due in three days” so tasks rise smoothly instead of all at once.
What I Learned
Building ToFilter taught me how slippery “priority” really is. You can ’t capture every nuance in a formula, but forcing myself to define variables like Value, Effects length, and Accurate Length made my thinking about tasks much clearer. It also gave me hands-on practice translating fuzzy productivity ideas into concrete spreadsheets and formulas.
Future improvements:
- Turn the spreadsheet logic into a small web app with a cleaner interface and real-time sliders.
- Add visualizations for how a task’s score changes as the due date approaches.
- Make the weighting system configurable so different people can tune ToFilter to their own risk/urgency tolerance.
- Build import/export so this can plug into other tools instead of being a standalone sheet.
Links
- Format: Excel / Google Sheets prototype
- Status: Personal experiment; not publicly released yet
- Related: Goal Bar (another experiment in quantifying and visualizing progress)