What It Does
- Focus on today's progress instead of being overwhelmed by the final goal
- See how much you need to complete today to stay on track
- Adjust your goal deadline easily and see updated daily targets
- Get an estimate to completion based on your actual progress rate
- Customize colors for each progress bar to match your preferences
- Toggle advanced stats on/off for a minimalist goal bar view
- Celebrate with visual feedback when you hit daily targets
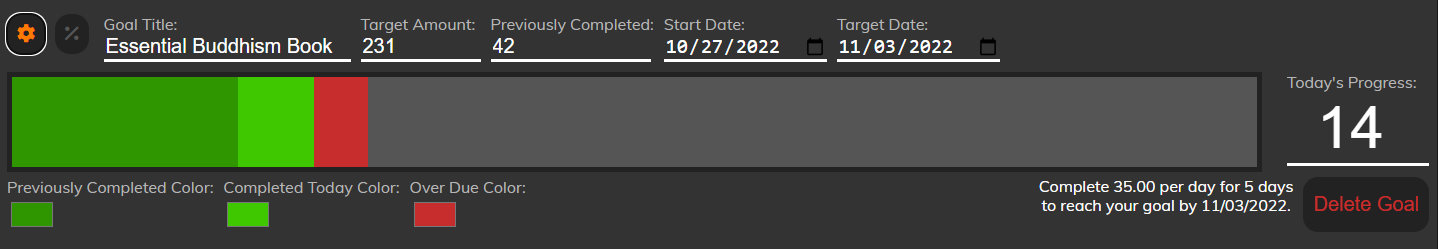 Configure your goal: set target dates, customize colors, and adjust progress units.
Why I Built This
I haven't always been a goal-oriented person. Over time, with practice, I started setting goals and seeing if I could achieve them. I learned that writing goals down makes them more likely to be achieved, and I experimented with S.M.A.R.T. goals and stretch goals. I collected and tested different approaches to goal setting and tracking, gradually leaning toward visual methods.
I started with a small notebook to track goals manually, then evolved to printed monthly goal sheets that I'd design by hand. But the printed sheets had a fatal flaw: I had to measure and design each goal bar manually in an illustration program every single month. It was tedious, inflexible, and time-consuming. I wanted something digital that could adapt as my goals changed.
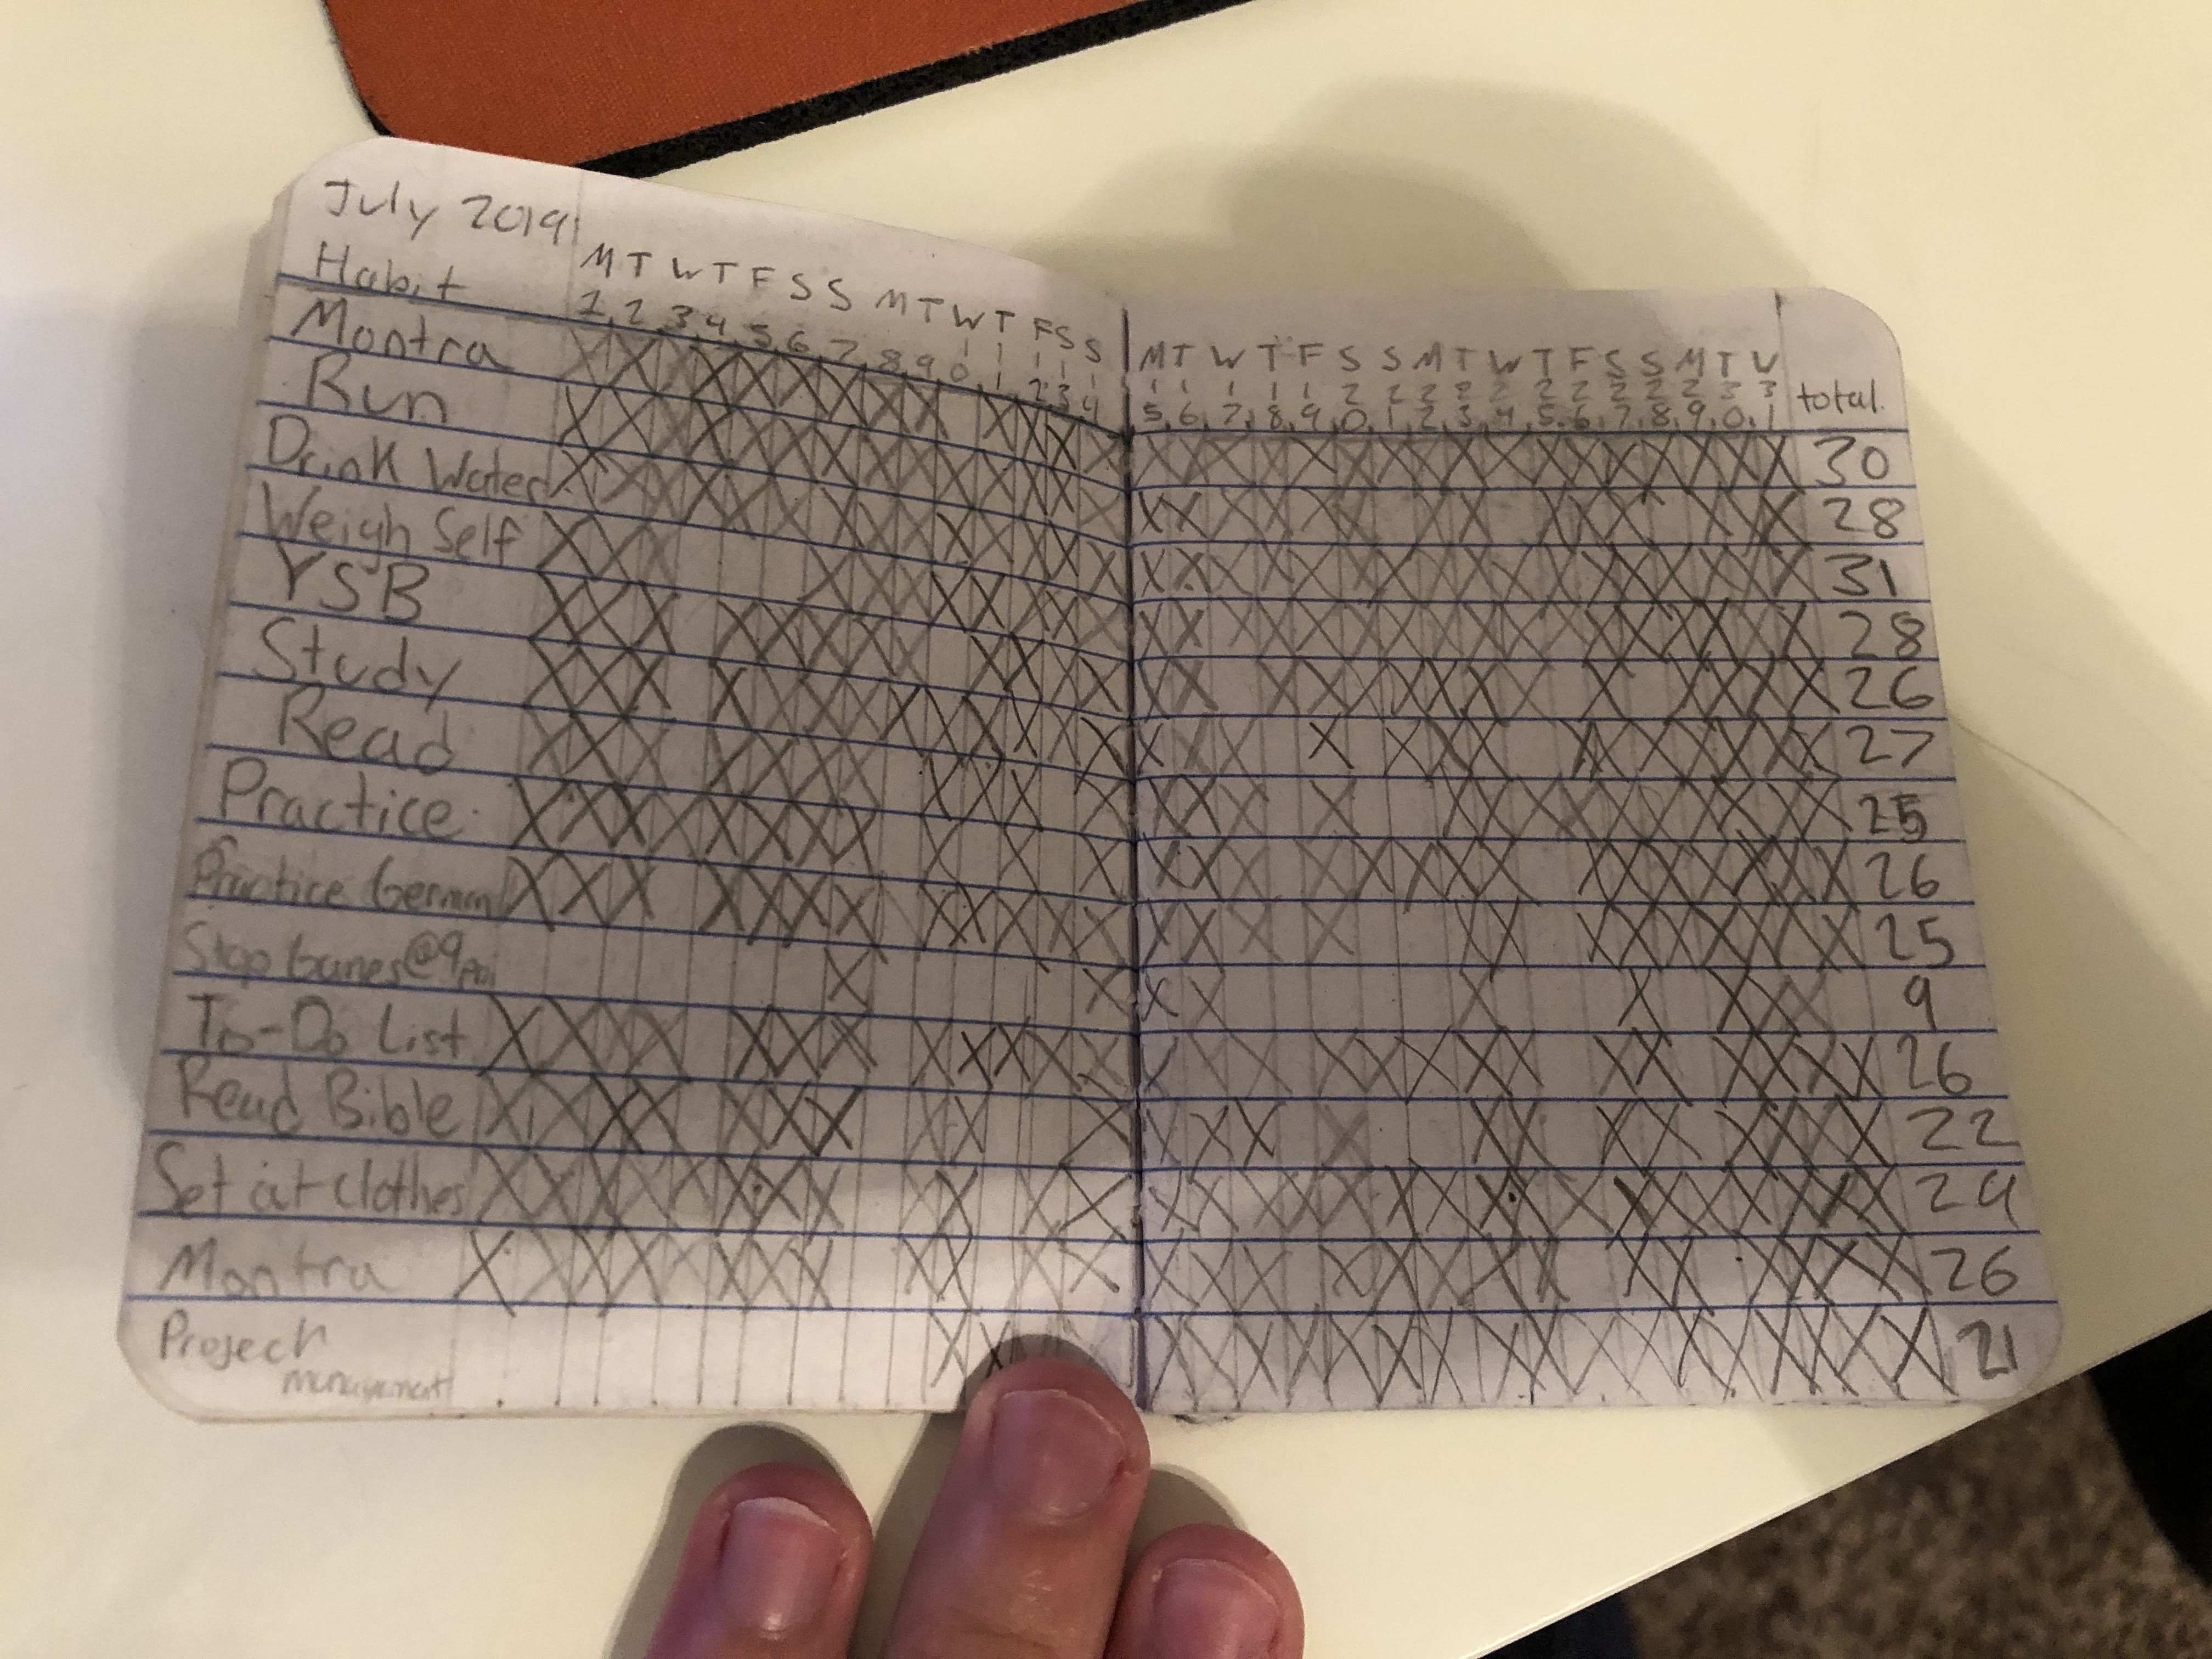 An early iteration: a small notebook I used to manually track my goals.
How It Works
The Goal Bar is built with vanilla JavaScript and uses localStorage to persist all goal data in the browser. Each goal tracks its starting value, target value, deadline, and current progress. The app calculates daily targets by dividing remaining work by remaining days, then visualizes progress using dynamically-sized div elements with configurable background colors.
When you hover over a goal bar, party.js provides celebratory confetti animations for completed daily targets. The stats panel uses date arithmetic to estimate completion based on your actual progress rate versus the planned rate. Everything is client-side—no backend, no database, just clean JavaScript and the browser's storage API.
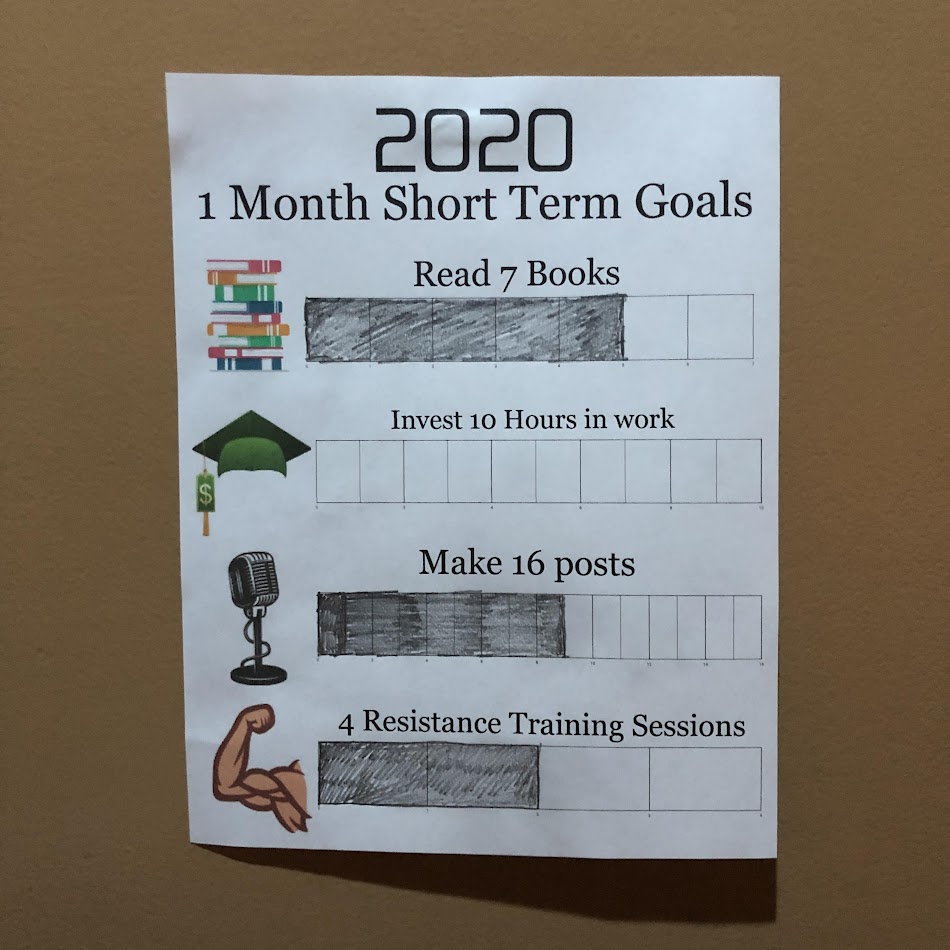 The second iteration: a printed goal sheet I designed monthly. This eventually became too tedious to maintain.
Impact
By the numbers:
- Used daily for personal goal tracking since 2022
- Replaced a manual design workflow that took 30+ minutes per month
- Part of the ToolDoBox suite with 8 productivity tools
What changed:
- Eliminated manual goal sheet design work entirely
- Made goal tracking flexible—I can adjust deadlines and targets instantly
- Created a tool I actually keep using (most goal trackers I tried, I abandoned)
- Shifted my focus from "am I done yet?" to "what can I do today?"
Challenges & Solutions
The hardest part was designing the math for daily target calculations. Goals can have different start dates, different units (pages, hours, items), and different progress rates. I had to handle edge cases like: What if someone falls behind? What if they're ahead? What if they change the deadline mid-goal?
I solved this by calculating everything from "today" rather than from the start date. The bar always shows: (1) progress so far, (2) what you should have done by today, and (3) what's left. This keeps the visualization honest and motivating even when you're behind schedule.
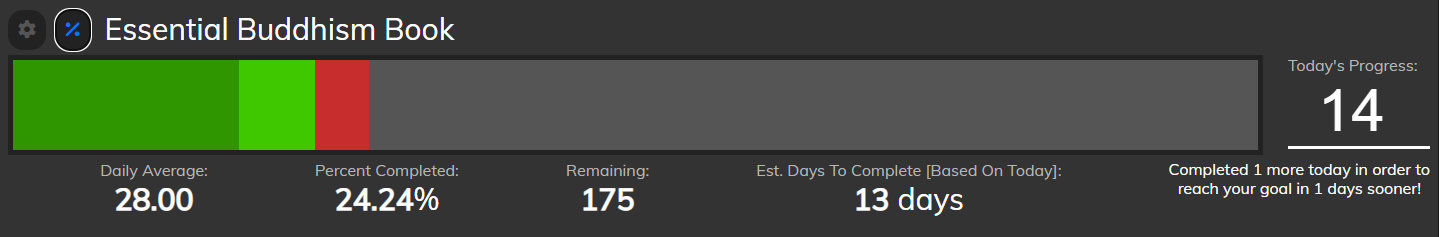 Advanced stats: see estimated completion based on actual progress, with toggle for minimalist view.
What I Learned
I learned that the best productivity tools are the ones you design for yourself—you understand your own friction points better than anyone. I also learned the power of date-based calculations in JavaScript and how to make localStorage robust enough for long-term personal data storage. Most importantly, I learned that good goal tracking isn't about guilt-tripping yourself when you're behind; it's about clarity on what you can do today.
Future improvements:
- Add goal templates (e.g., "Read 12 books this year" auto-configures to ~1 book/month)
- Export/import goals as JSON for backup and sharing
- Add weekly view mode for goals that work better in week chunks
- Build a companion mobile widget for at-a-glance progress checks
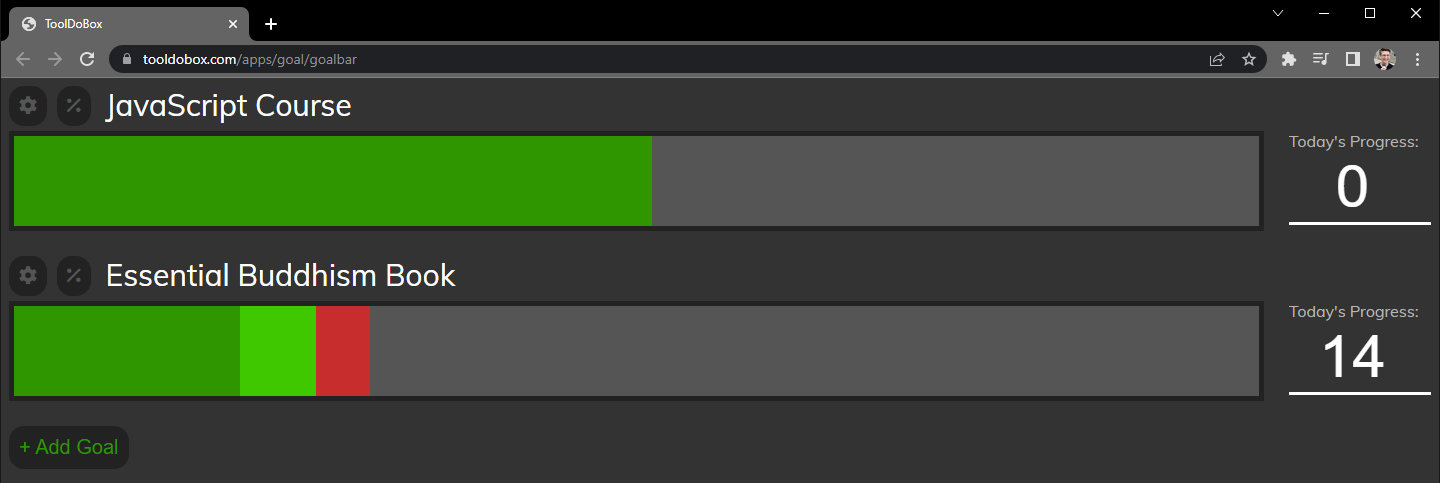
 Celebrate progress: confetti animation when you hit today's target.
Links
- Live Demo: tooldobox.com/apps/goal/goalbar
- Code: Private (part of ToolDoBox suite)
- Related: Productivity Bar (sister tool for time-boxing work sessions)